Fig. 6.
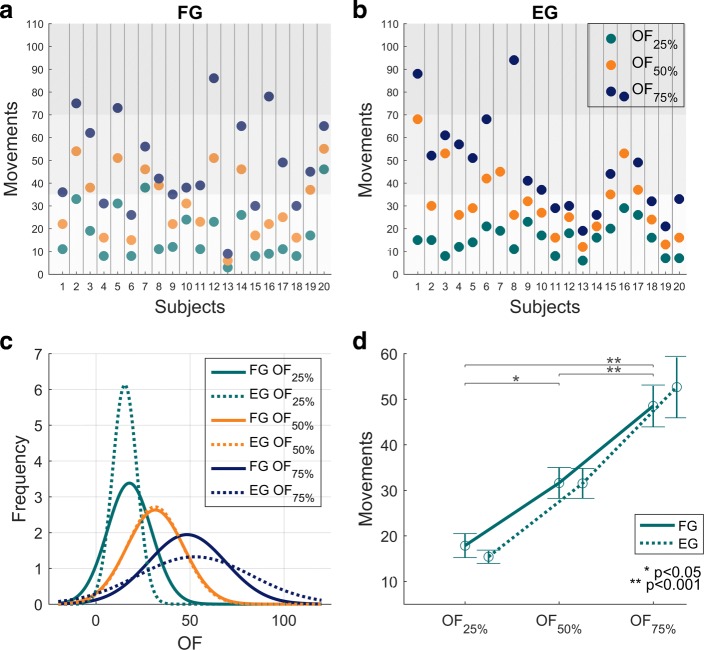
OF results. Results related to OF indicators (Onset of Fatigue). Panels a and b show, for each FG subject (panel a) and EG subject (panel b), the values of the three OF indicators: OF25%,OF50%,OF75%, expressed as number of “movements” that satisfy Eq. 3. Grey areas divide the task in three phases. Panel c shows the Gaussian approximation of the probability density functions of the three OF indicators for the FG population (solid lines) and EG population (dashed lines). Panel d shows the mean values and standard errors of the three OF indicators for the FG population (solid line) and the EG population (dashed line)

