Fig 2.

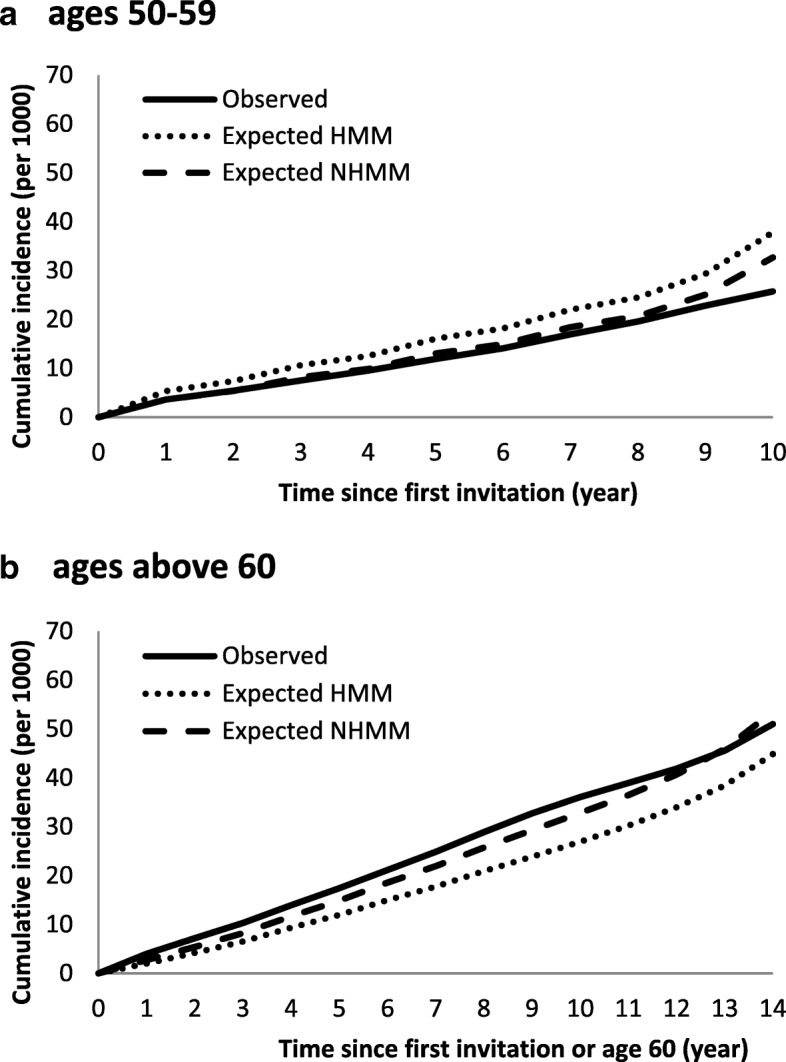
The observed and expected cumulative incidence rate in the homogeneous (HMM) and the non-homogeneous multi-state (NHMM) models. (a) Ages 50–59. (b) Ages above 60

The observed and expected cumulative incidence rate in the homogeneous (HMM) and the non-homogeneous multi-state (NHMM) models. (a) Ages 50–59. (b) Ages above 60