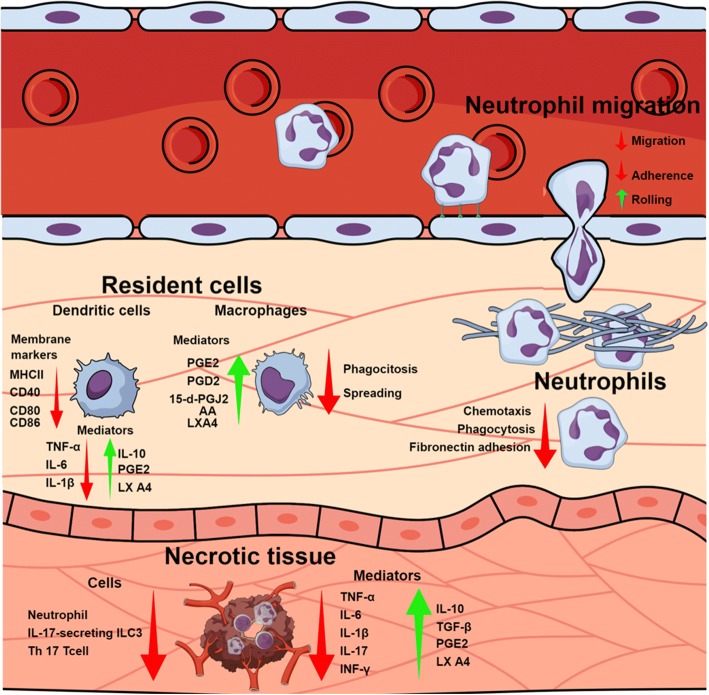
Fig. 2.
Crotoxin’s anti-inflammatory modulation. Schematic figure on circulation, tissue and cellular events modulated by Crotoxin and its subunits during inflammatory stimulus. The figure illustrates the migration (adherence, rolling and chemotaxis) and function (phagocytosis and spreading) of blood-derived, resident and tissue necrotic leukocytes, as well as the expression of pro-inflammatory (IL-1β, IL-6, IL-17, TNF-α and INF-γ), anti-inflammatory mediators (IL-10, TGF-β, PGE2, PGD2, 15-d-PGJ2, LXA4 and arachidonic acid – AA) and surface inflammatory markers (MHC-II, CD40, CD80 and CD86). Green arrows indicate events/mediators that are stimulated/increased by Crotoxin, while red arrows indicate those that are inhibited/reduced. The illustration was created using Mind the Graph platform (www.mindthegraph.com)

