. 2018 Sep 20;9(47):8850–8859. doi: 10.1039/c8sc03655a

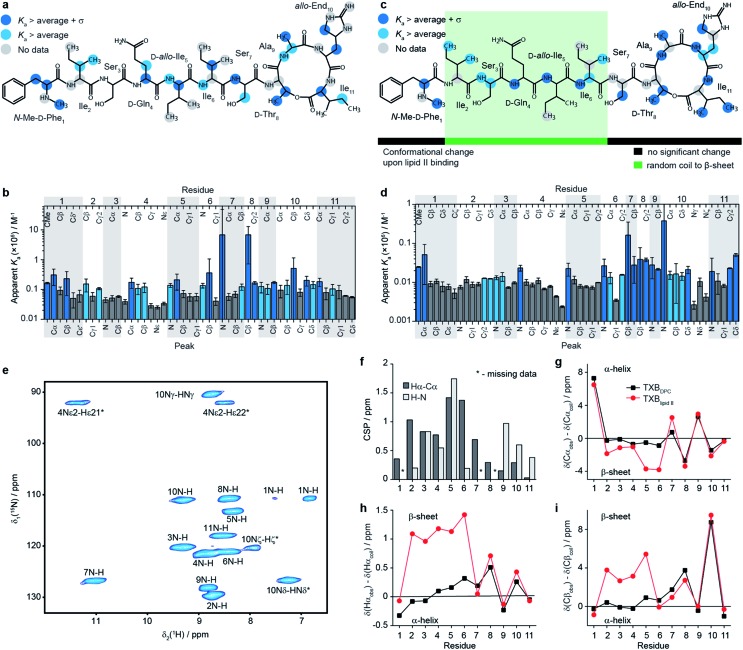
Fig. 2. Characterisation of the teixobactin–lipid II complex. (a–d) Results of solution NMR titrations of teixobactin with a water soluble C15 variant of Gram-positive lipid II in aqueous solution (a, b) and with native C55 Gram-negative lipid II in DPC micelles (c, d). Panels b and d show the measured apparent Ka values and plotted onto the chemical structure of teixobactin in a and c. Dark blue indicates sites with apparent Ka values higher than the average plus one standard deviation and light blue indicates sites with apparent Ka values higher than the average. Dark grey indicates sites with a below average apparent Ka (b and d). In a and c grey circles indicate sites for which data are not available. (e) 2D 1H-15N solid state NMR correlation spectrum of sedimented [U13C-15N]teixobactin in complex with natural abundance Gram-negative lipid II in DPC micelles acquired at 600 MHz 1H Larmor frequency and 90 kHz magic angle spinning frequency. In panel e star indicates peaks folded in the 15N dimension. The two resonances for residue 1 are due to the zwitterionic form of N-Me-d-Phe1 being the major form at pH 6.5. (f) 1H-15N (light grey) and 1Hα-13Cα (dark grey) chemical shift perturbations between TXBDPC and TXBlipid II. Comparisons of secondary 13Cα (g), 1Hα (h) and 13Cβ (i) chemical shifts between TXBDPC (black squares) and TXBlipid II (red circles).

Fig. 2