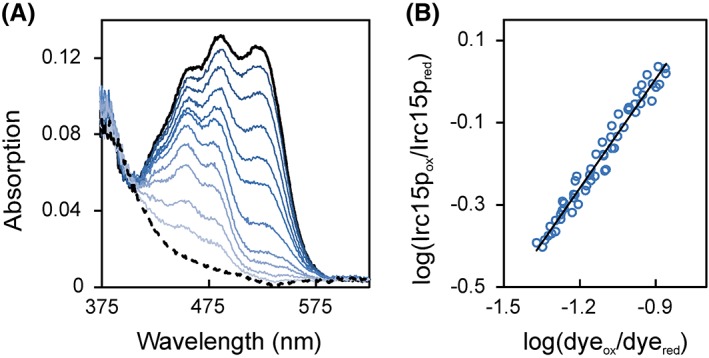
Figure 3.

Redox potential determination of Irc15p in the presence of safranine T. (A) The absorption spectrum of the fully oxidized and fully reduced species are represented by a solid and dashed black line, respectively. Selected spectra of the course of reduction are represented in different shades of blue. 10 μM Irc15p was reduced by the xanthine/xanthine oxidase electron delivering system in the presence of safranine T over a time period of ~100 min. Data points for evaluation were extracted at 430 nm and 530 nm for Irc15p and for the dye safranine T, respectively. (B) Double logarithmic plot of the concentration of oxidized/reduced Irc15p vs. the concentration of oxidized/reduced safranine T (Nernst plot).
