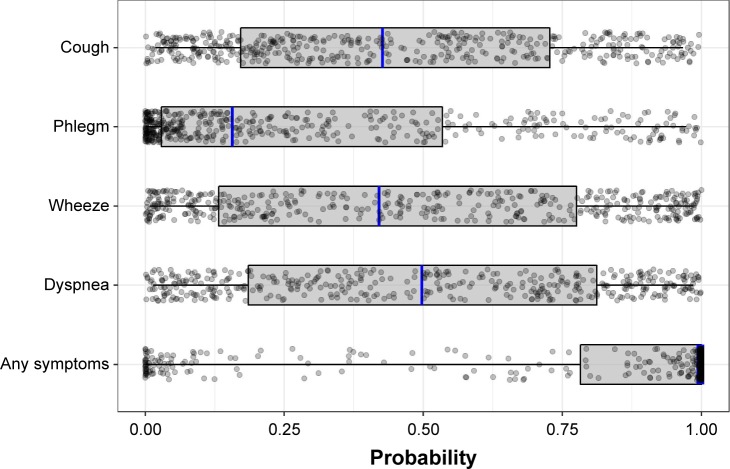
Figure 2.
The distribution of individual-specific probabilitiesa of the occurrence of symptoms. The box spans the lower and upper quartiles (25%–75%) of individuals around the median (blue line).
Notes: aIndividual random effects are drawn from a normal distribution with a mean of 0 and SD of the fitted random effects. The statistics shown by the boxes were determined from 1,000 repetitions for each individual, and the points show the results of one repetition.

