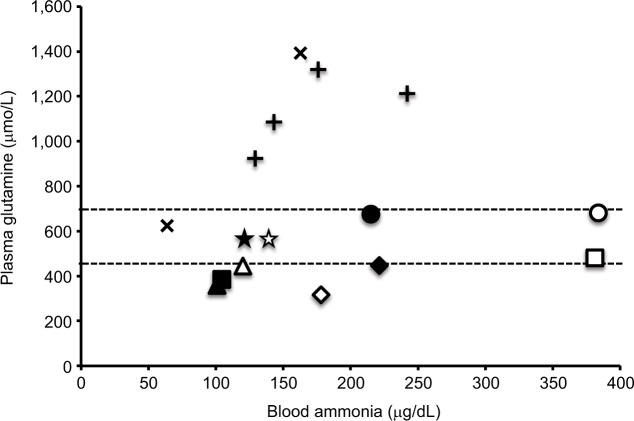
Figure 7.
Relationship between blood ammonia and plasma glutamine.
Notes: Dotted lines represent normal range of plasma glutamine levels. Each marker represents as follows: cross symbol represents carbamoyl phosphate synthetase deficiency, plus sign represents ornithine transcarbamylase deficiency, and other markers are different patients with CTLN2.

