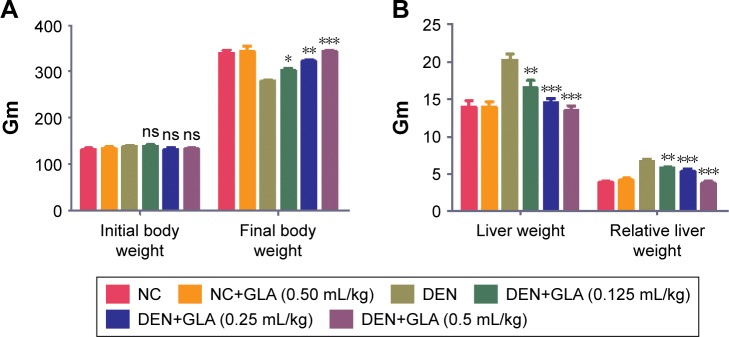
Figure 1.
Effect of GLA on body weight and tissue weight.
Notes: (A) The initial body weight and final body weight of all group rats, and (B) the hepatic tissue and relative tissue weight method as described in the Materials and methods section. All values are presented as mean±SEM. Statistical analysis by one-way ANOVA followed by Dunnett’s multiple comparison. *P<0.05, **P<0.01 and ***P<0.001.
Abbreviations: ns, non-significant; DEN, diethylnitrosamine; GLA, gamma linolenic acid; NC, normal control.

