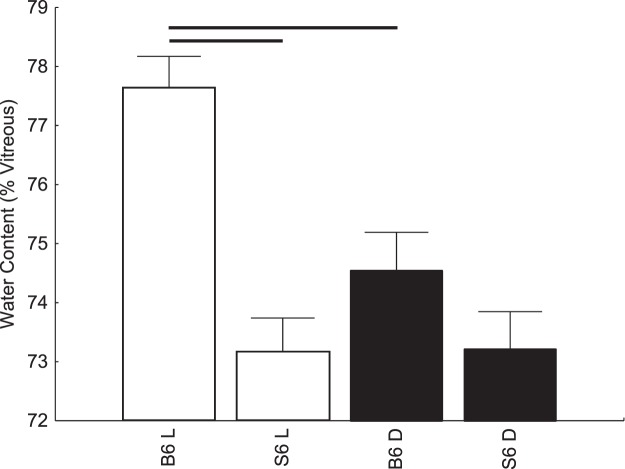
Figure 2.
A summary of modeled central water content (as a percent of preretinal vitreous signal) in the posterior retina (80%–100% depth from the vitreoretina border) during dark (closed symbols) and at 20 to 21 minutes of ∼500 lux light (open symbols). C57BL/6 (n = 7, dark; n = 6, light), and 129S6/SvEvTac (n = 5 dark-light pairs) mice. Horizontal range bar indicates the region with significant differences (P < 0.05) between profiles.

