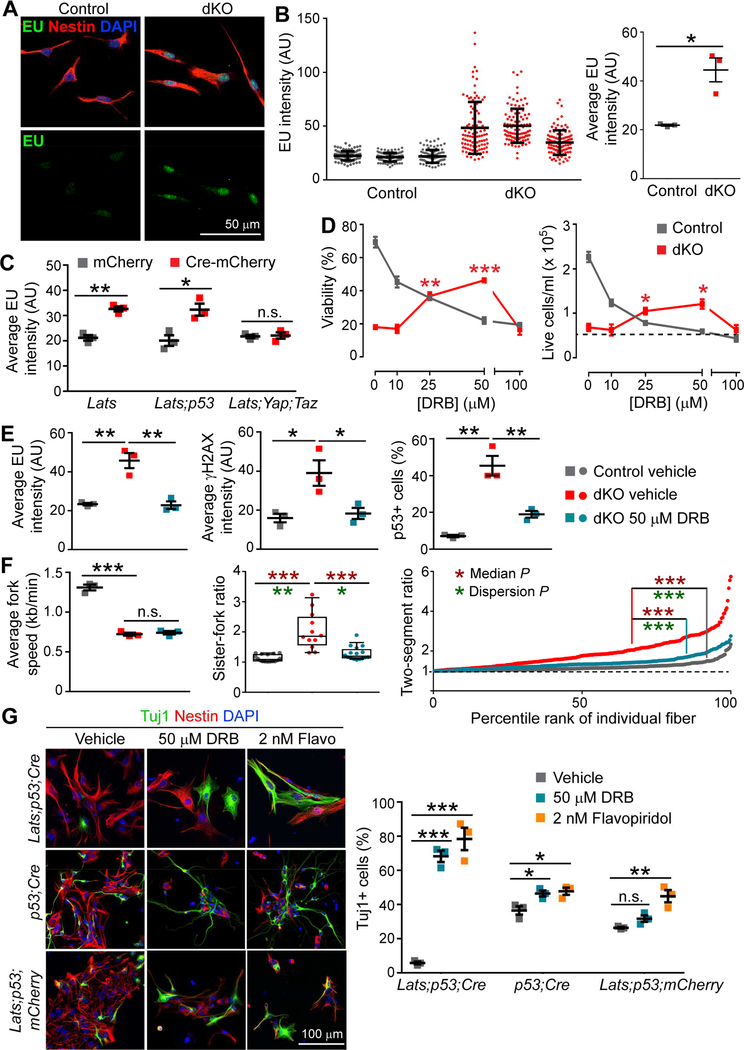
Figure 6. Hypertranscription Contributes to Defects of LATS-Deficient NSCs.
(A) Representative images of EU staining after 1 h of labeling.
(B) Quantification of nuclear EU intensity. Left panel: EU intensity of individual cells (mean ± SD). Right panel: Average intensity of each culture.
(C) Average EU intensity of NSCs with the indicated floxed alleles transfected with mCherry or Cre-mCherry plasmid.
(D) Dose-response curves for NSCs treated with the transcription inhibitor DRB for 24 h. Comparisons are against the results of vehicle-treated dKO NSCs. The dashed line shows the number of live cells plated at 0 h.
(E) Effects of treating dKO NSCs with DRB on EU incorporation, γH2AX, and p53 activation.
(F) Effects of treating dKO NSCs with DRB on the replication fork speeds, sister-fork ratios, and two-segment ratios. For the fork ratios, Wilcox rank-sum test and Ansari-Bradley test were used to compare the median and dispersion, respectively.
(G) Immunostaining and quantification of NSCs of the indicated genotypes grown in differentiation medium with transcription inhibitors for 3 days.
Data are shown as mean ± SEM unless otherwise noted; *P < 0.05; **P < 0.01; ***P < 0.001; n.s., not significant. See also Figure S6.

