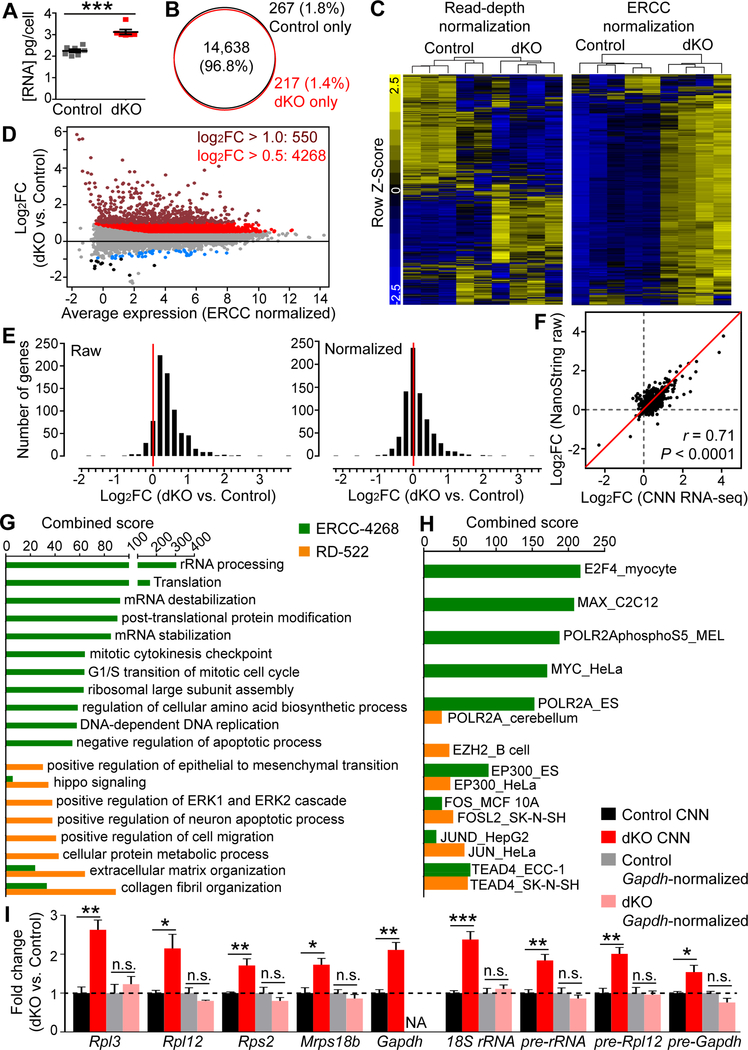
Figure 7. CNN RNA-seq Reveals Global Transcriptome Shift in LATS-Deficient Brains.
(A) Quantification of total RNA content per cell for E12.5 control and Lats1/2;Nestin-Cre dKO telencephalic cells (mean ± SEM).
(B) Venn diagram showing overlap of expressed genes defined by having at least 1 cpm RNAseq reads in E12.5 control and dKO brains.
(C) Gene expression heatmaps for the top 3000 genes that were most varied in read-depth–normalized and ERCC–normalized data.
(D) MA plot of differentially expressed genes (FDR < 0.05). Colored dots highlight genes with FDR < 0.01 and with the following fold changes (FC): maroon, log2FC > 1; red, log2FC > 0.5; blue, log2FC < −0.5; black, log2FC < −1.
(E) Histograms showing gene expression changes in E12.5 dKO telencephalic cells relative to equal numbers of control cells as measured by NanoString without normalization (left panel) or after normalization to housekeeping genes (right panel).
(F) Comparison of NanoString and CNN RNA-seq data. Pearson correlation analysis.
(G) Top GO Biological Processes terms enriched in the ERCC-4268 and RD-522 gene sets.
(H) Top transcription factors whose targets (predicted based on ENCODE ChIP-seq data) were enriched in the ERCC-4268 and RD-522 gene sets.
(I) qRT-PCR analysis of some of the upregulated genes identified by CNN RNA-seq (mean ± SEM).
*P < 0.05; **P < 0.01; ***P < 0.001; n.s., not significant. See also Figure S7, and Tables S2 and S3.

