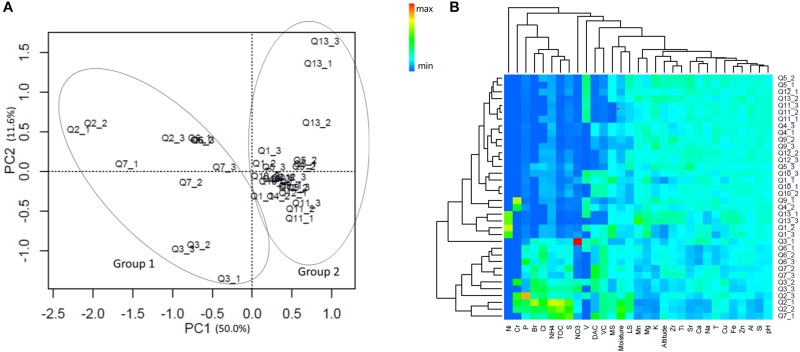
FIGURE 1.
(A) Principle component analysis (PCA) and (B) heatmap cluster analysis of the normalized soil elemental compositions and environmental attribute data. The values of PC1 and 2 are percentages of total variations that can be attributed to the corresponding axis. T, temperature; TOC, total organic carbon; MS, moss species amount; LS, lichen species amount; DAC, hairgrass (Deschampsia antarctica) coverage; and VC, total vegetation coverage.

