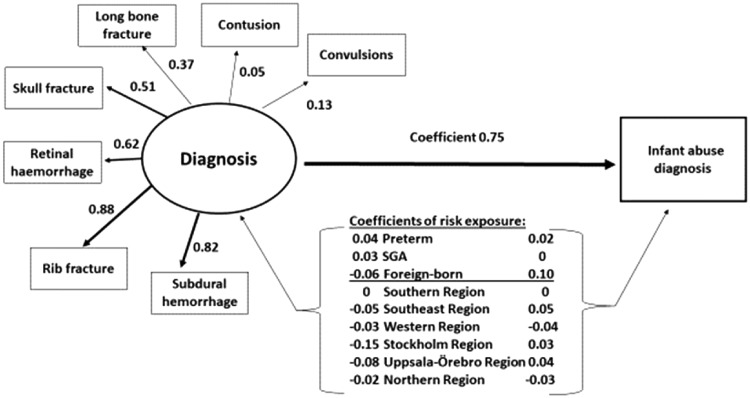
Figure 2.
Conceptual model for diagnosis of infant abuse in Sweden in 1997–2014, performed in a Structural Equation Modelling (SEM) framework. Observed variables are given inside rectangles. The latent diagnosis variable is drawn as an ellipse. Arrows radiating out from the ellipse and pointing to the observed diagnoses represent factor loadings. Coefficients represented by arrows pointing to ‘Infant abuse diagnosis’ should be interpreted as the increase in z-score for the probability of observing the outcome. For the risk exposures, the coefficients represent the increase in z-score if the condition is present. For the latent diagnosis variable, the coefficient represents the increase in z-score for a standard deviation (SD) increase in the latent diagnosis variable. The coefficient for the Southern health region was set to zero as a reference for the other health regions. SGA = small for gestational age

