FIGURE 2.
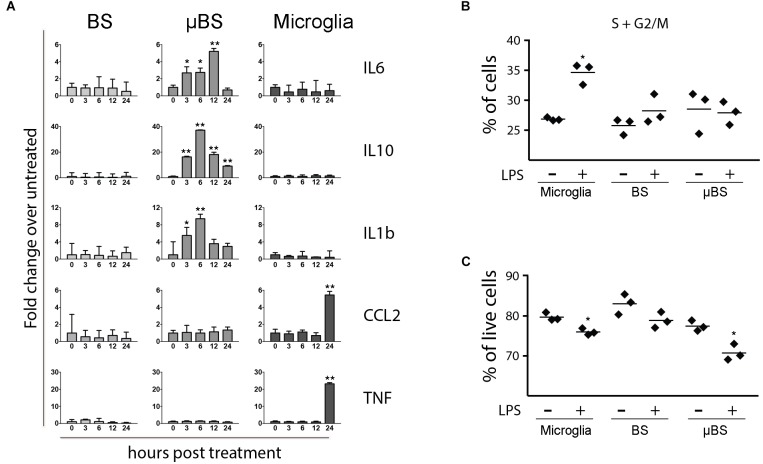
Differences between BS, μBS, and microglia after LPS treatment. The microglia, BS, μBS, were exposed to 20 ng/mL LPS up to 24 h. (A) shows gene expression of IL6, IL10, IL1b, CCL2, and TNFa after LPS treatment on the different models (BS, μBS, and microglia cells). Data are shown as fold change of treated versus untreated up to an hour post treatment (3, 6, 12, and 24 h after treatment). (B) show changes in cell cycle in percentage of the cells in G2 plus S phase in microglia cells, BS and μBS treated or non-treated with LPS. Each dot symbol represent a replicate sample (n+3). (C) shows Annexin V Apoptosis Muse assay. Results show % live cells microglia, BS, ad μBS cells treated (+) or not treated (–) with LPS. Each symbol represent a replicate (n = 3). Statistical analysis in A was performed using Dunnett test on ΔΔCt. The asterisks symbols represents ∗P < 0.05 and ∗∗P < 0.01 (two independent experiments and three biological replicates on each experiment).

