
FIGURE 3.
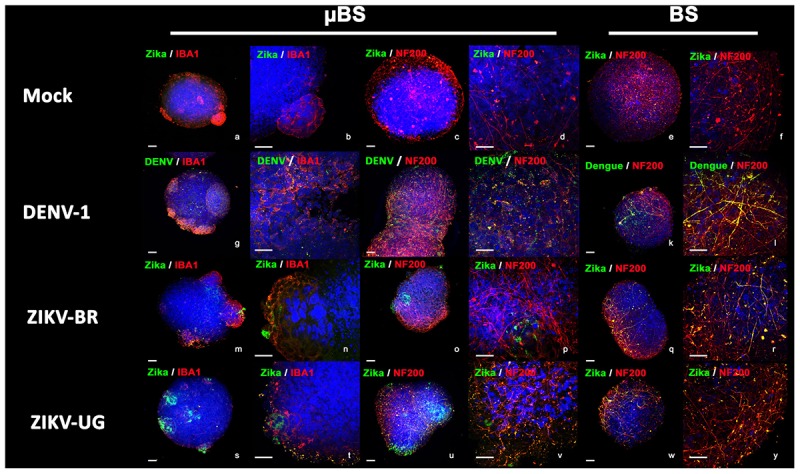
Virus infection in BrainSpheres. Figure shows virus infection by immunohistochemistry in BrainSpheres with (μBS) and without microglia (BS). Green represents the Flavivirus marker for ZIKV (NS1) and DENV-1, red represents microglia markers IBA1 and NF200. Bars represent 50 μm (lower magnification) and 10 μm (higher magnification).