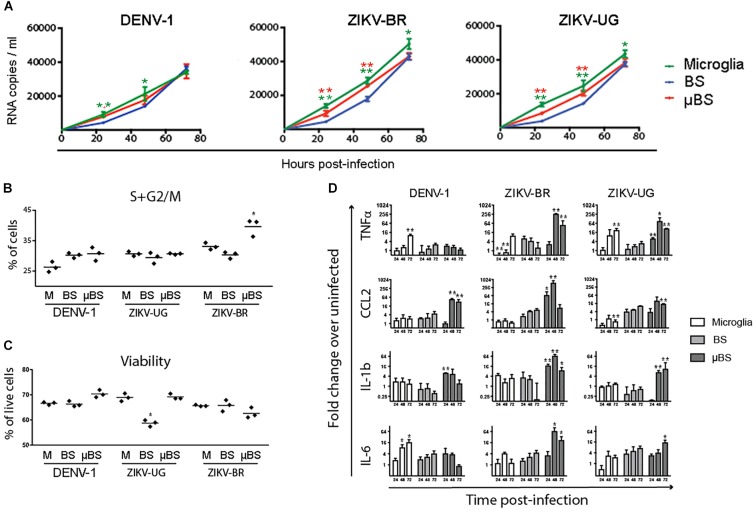
FIGURE 4.
Effects of Flavivirus infection on 3D human iPSC-derived brain spheres (BrainSpheres, BS) without or with microglia cells (μBS). The microglia cells, BS, and μBS were infected with Dengue, ZIKV-BR, and ZIKV-UG using MOI equal 0.1. (A) shows the growth kinetics of flaviviruses over time for the three models. The viral load (RNA copies/mL) are shown with standard deviation. (B) Changes in cell cycle shown as percentage of cells in G2/S phase in BS, μBS, and microglia treated or non-treated with the different viruses. (C) Annexin V Apoptosis Muse assay results. Results represent % live cells in BS, μBS, and microglia samples after the different flavivirus treatments. (D) Gene expression relative quantification for TNFα, CCL2, IL-1b, and IL-6 over the time. Statistical analysis was performed using the Dunnett’s Test (∗mean equal p < 0.05 and ∗∗p < 0.01) for two independent experiments, three biological replicates on each experiment.

