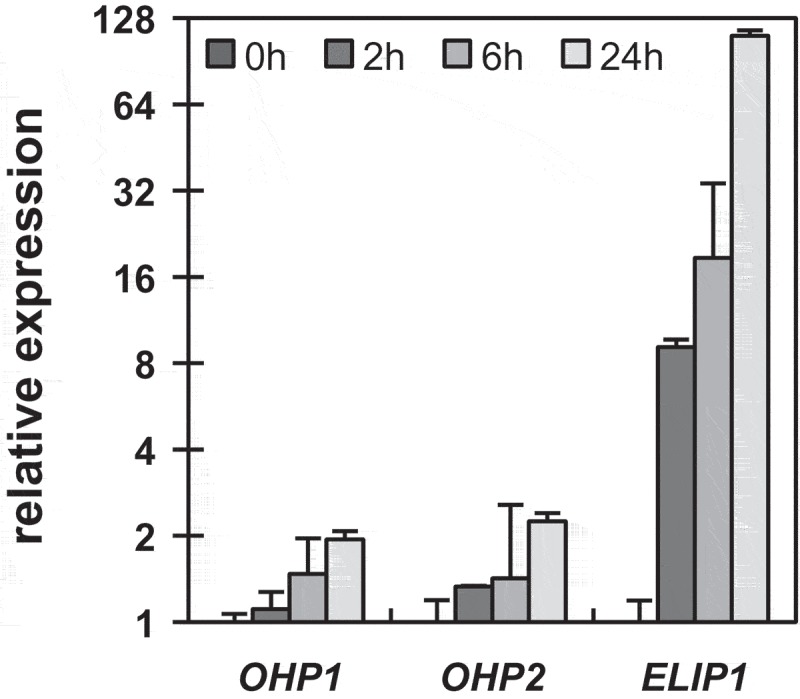
Figure 2.

Light-induced expression of OHP transcripts.
RT-qPCR analysis of OHP1, OHP2 and ELIP1 transcripts in VIGS-GFP plants during exposure to HL. Data were analyzed by the ΔΔCt-method and expression was normalized to the first time-point (t0). A mean value of three biological replicates is shown, error bars represent standard deviation.
