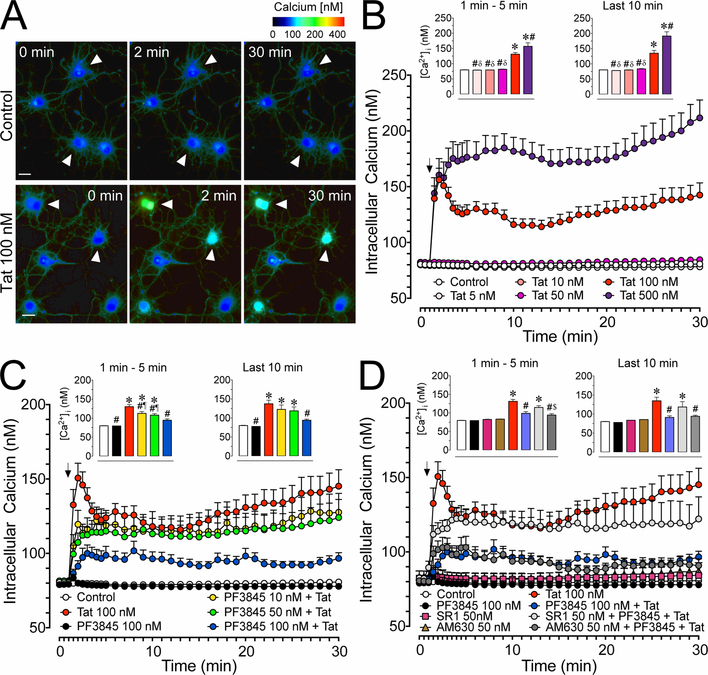
Figure 2. Calcium changes in cultured PFC neurons over 30 min.
(A) Pseudocolor images of control and Tat conditions assessing changes in [Ca2+]i levels by ratiometric imaging of fura-2AM indicated minimal changes for control (white arrowheads, top row) but prominent changes for Tat 100 nM over a 30 min time period (white arrowheads, bottom row). (B) Significant Tat concentration dependent increases in [Ca2+]i levels were noted over 30 min with Tat 100 nM and 500 nM being significantly different from control. (C) The significant increase in [Ca2+]i levels by Tat 100 nM was significantly decreased by PF3845 pretreatment (10, 50, 100 nM) in a concentration-dependent manner (PF3845 pretreatment 30 min prior Tat application). (D) The protective effect of PF3845 100 nM pretreatment against Tat-induced increase in [Ca2+]i levels was blocked by SR1 50 nM but not AM630 50 nM (CBR pretreatment 30 min prior PF3845 application). Statistical significance was assessed by ANOVAs followed by Bonferroni’s post hoc tests; *p < 0.05 vs. control, #p < 0.05 vs. Tat 100 nM, δp < 0.001 vs. Tat 500 nM, ¶p < 0.05 vs. PF3845 100 nM, $p < 0.001 vs. SR1 50 nM + PF3845 100 nM + Tat 100 nM (at least three independent experiments). SR1: SR141716A. Scale bars = 20 μm.

