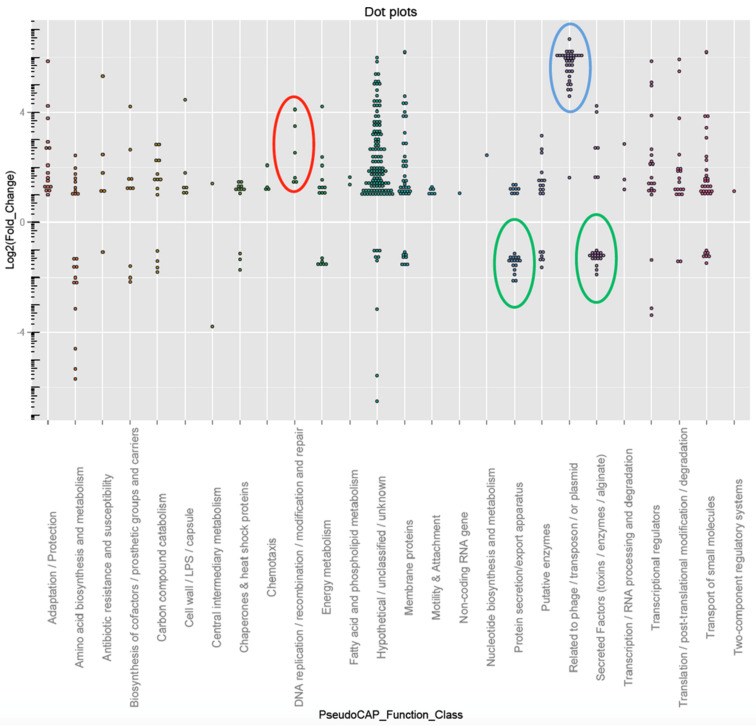
Figure 3.
Function enrichment of differentially expressed genes from the transcriptomic analysis. A dot-lot figure was generated using ggplot2 the package of R. Red circle highlights the genes involved in DNA replication and repair; blue circle highlights the genes involved in pyocin synthesis; green circle highlights the genes involved in protein secretion (T3SS).

