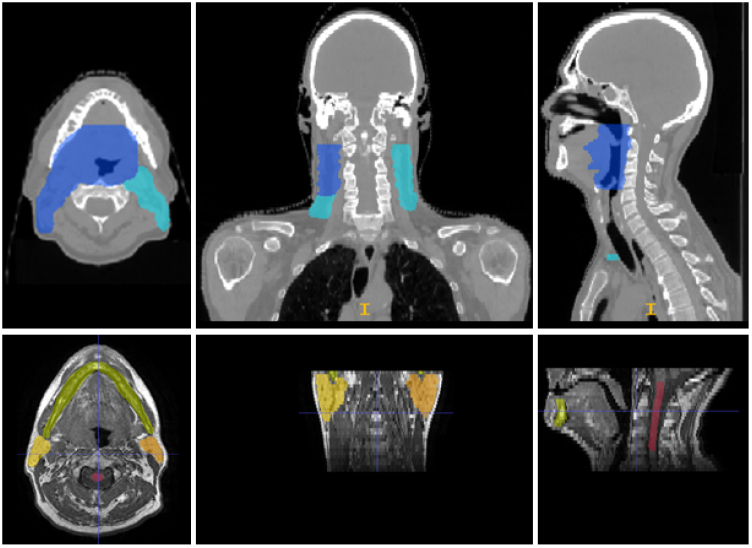
Figure 2.
This figure depicts axial, coronal and sagittal slices of the CT (top row) and MR (bottom row) images of one example patient from the database used in this study. The coloured regions represent the manual segmentations of the primary planning target volume (PTV) (blue) and the secondary PTV (turquoise) on the CT, as well as the left (orange) and right (yellow) parotids, the mandible (green) and the spinal cord (red) on the MR images.

