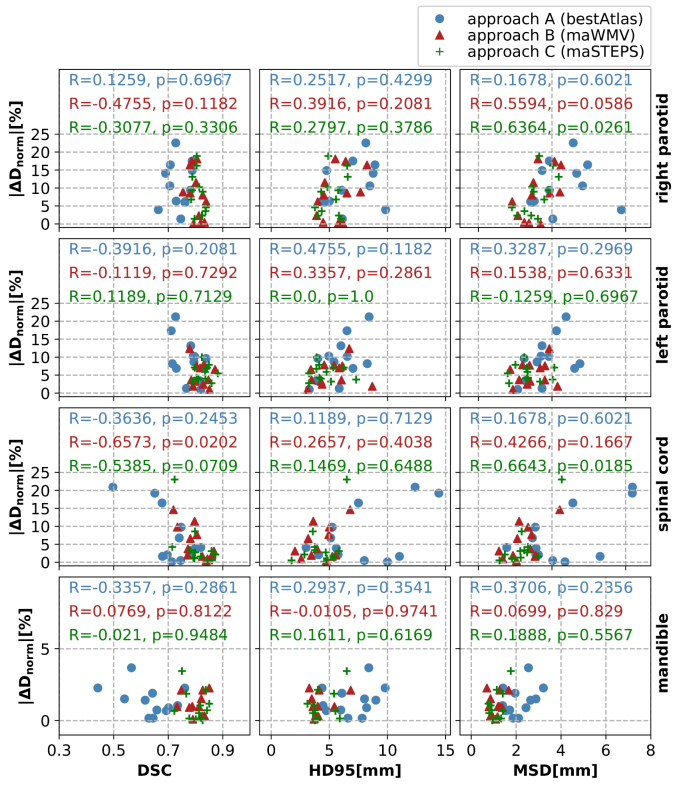
Figure 5.
Scatter plots illustrating dose differences between manually and auto-segmented VOIs normalised to the clinical goal as a function of the respective geometric measures (from left to right: DSC, HD95 and MSD), separated according to the VOIs used in this study (from top to bottom: right parotid, left parotid, spinal cord and mandible). The different colours and symbols illustrate the three auto-segmentation methods of this study. The numbers in each subplot are the respective correlation coefficients R together with the p-values, calculated using Spearman’s approach.

