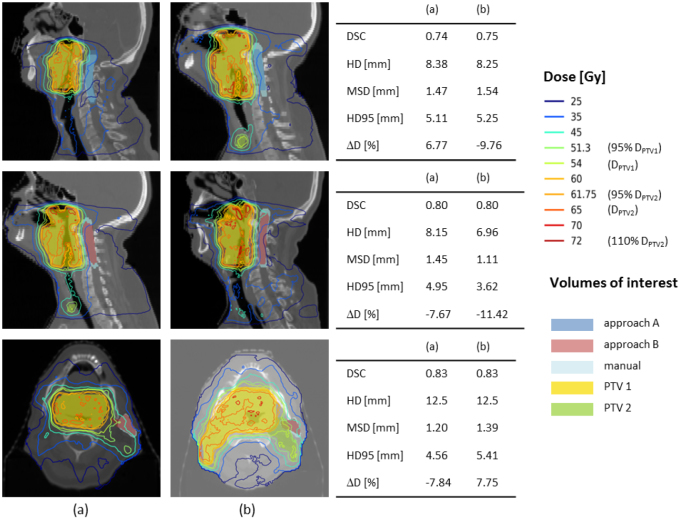
Figure 6.
This figures illustrates three example cases where the geometric differences (DSC, HD, HD95 and MSD) were similar between the patients in columns (a) and (b) but the dosimetric impact differed, as shown in the tables in the last column. The first two rows illustrate examples for the spinal cord, the last row for the left parotid. Coloured lines represent selected isodose lines with the prescribed doses to the target volumes indicated in brackets. Coloured areas illustrate relevant VOIs: auto-segmented OARs using approach A (blue) and approach B (red), respectively, manually segmented OARs (light blue), primary PTV (yellow) and secondary PTV (green).

