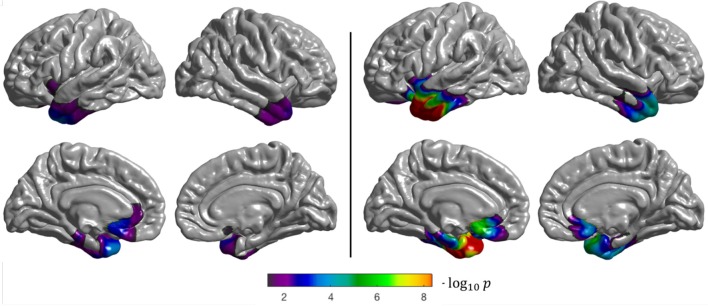
Figure 6.
Results of the group comparison (2-sample t-test) performed on the CAPPSEMANTIC dataset (CN vs. svPPA). Left: surface-based analysis, right: volume-based analysis after projection of the results onto FsAverage. The p-values were corrected to the vertex (left), and to the voxel (right) level, then thresholded to only show significant p-values (p < 0.05). The Sørensen-Dice coefficient between the two binarized statistical maps is 0.59.

