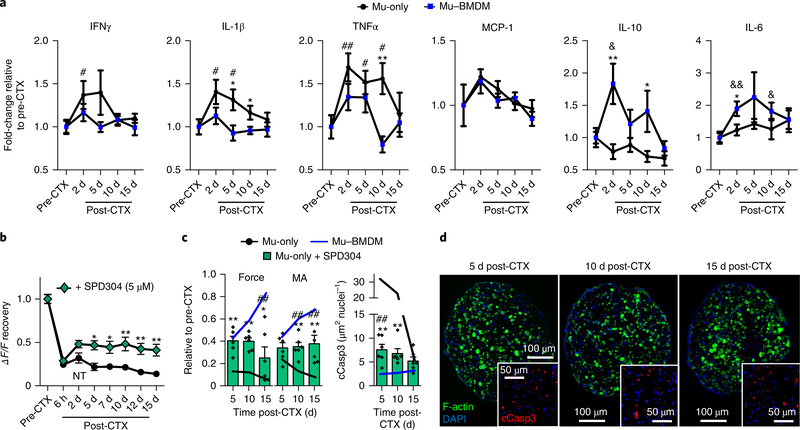
Fig. 6 |. Cytokine analysis following injury of engineered muscle and the effects of TNFα inhibition on recovery.
a, Cytokine concentrations relative to pre-injury levels in media conditioned by Mu-only and Mu–BMDM tissues pre-CTX and at 2, 5, 10 and 15 d post-CTX. ★P < 0.05 and ★★P < 0.01 between groups at the same time point; and #P < 0.05 and ##P < 0.001, and &P < 0.05 and &&P < 0.001 compared with pre-CTX values in Mu-only and Mu–BMDM groups, respectively (n = 12 independent experiments). b, Plot of GCamp6 signal (ΔF/F) recovery in Mu-only constructs exposed to the TNFα inhibitor SPD304. ★P < 0.05 and ★★P < 0.001 compared with Mu-only constructs at same time point. The symbol dictating significance is designated to each point included within brackets (n = 12 independent samples). c, Plots of force and muscle area (MA) recovery (relative to pre-CTX values) and cleaved caspase-3 (cCasp3) area per nuclei in Mu-only constructs exposed to SPD304. ★P < 0.05 and ★★P < 0.001 compared with Mu-only constructs at the same time point; and ##P < 0.001 compared with Mu–BMDM constructs ( n = 6 independent samples). d, Representative staining of cross-sections of myofibres and cCasp3 (inset) at 5, 10 and 15 d post-CTX in SPD304-treated constructs. All bars and points denote means ± s.e.m. Significance was determined by two-way analysis of variance and Bonferroni-corrected post-hoc two-sided t-tests. Supplementary Table 4 lists exact P values when greater than 0.0001.

