
Figure 2:
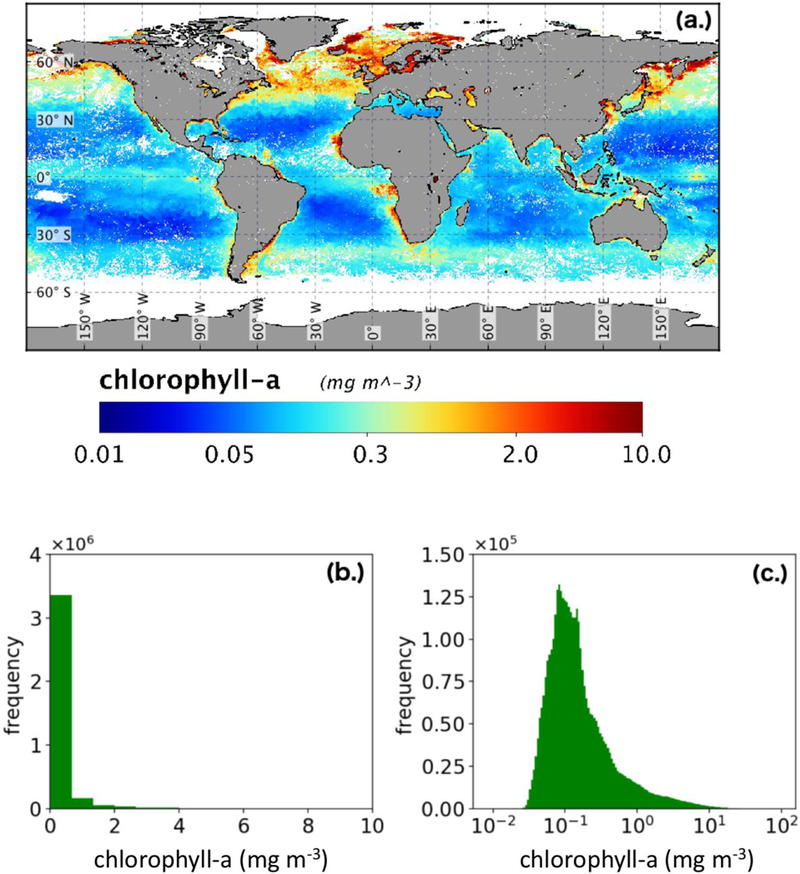
(a.) SeaWiFS chlorophyll-a concentration for May 1998. Subplots (b.) and (c.) show how global chlorophyll-a concentration for May 1998 is nearly log-normally distributed.
Official websites use .gov
A
.gov website belongs to an official
government organization in the United States.
Secure .gov websites use HTTPS
A lock (
) or https:// means you've safely
connected to the .gov website. Share sensitive
information only on official, secure websites.
(a.) SeaWiFS chlorophyll-a concentration for May 1998. Subplots (b.) and (c.) show how global chlorophyll-a concentration for May 1998 is nearly log-normally distributed.