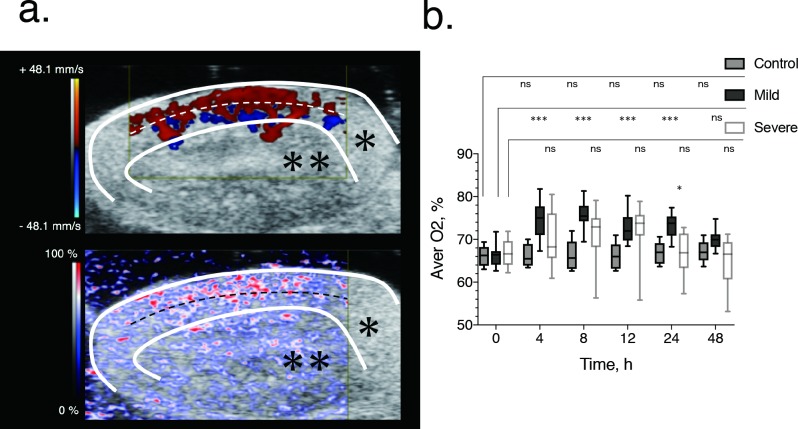
Fig 2. Image-based quantification and longitudinal time course of oxygen saturation after renal ischemia-reperfusion in the mild and severe ischemia groups.
(a) Normal renal blood flow (top) and renal tissue saturation (bottom), showing blood flow in the cortex, around the medullary border region, indicative of high oxygen saturation. The white and black dashed lines indicate the cortical medullary border. The regions in which Doppler ultrasound signals of the renal arcuate arteries and veins are observed correspond to the medulla and external cortex. The white line indicates the kidney parenchyma. The color map (graduated from red to blue), which is based on the principle of using the difference in light absorption wavelength between oxygenated hemoglobin (850 nm) and deoxygenated hemoglobin (750 nm) as a signal, shows the change from high (red) to low (blue) oxygen saturation. The white lines delimit the renal parenchyma (*) and the area outside represents the urinary tract (renal pelvis) (**). Scale bar, 2 mm. (b) Box-and-whisker plots of the time course of renal oxygen saturation for the mild (black) and severe (red) ischemia-reperfusion group. The box indicates the 25th and 75th quartiles, with the line inside each box indicating the median and the whiskers, the maximum and minimum renal oxygen saturation. The asterisk indicates significant between-group differences (P<0.050) in renal oxygen saturation at 24 h after AKI-induction using Dunn’s multiple comparisons as a non-parametric test. Comparisons between oxygen saturation before injury and at the different time points of measurement after injury (4, 8, 12, 24 and 48 hours) were also evaluated using the Dunn’s multiple comparisons. *p < 0.050, ***p < 0.001, ns not significant.

