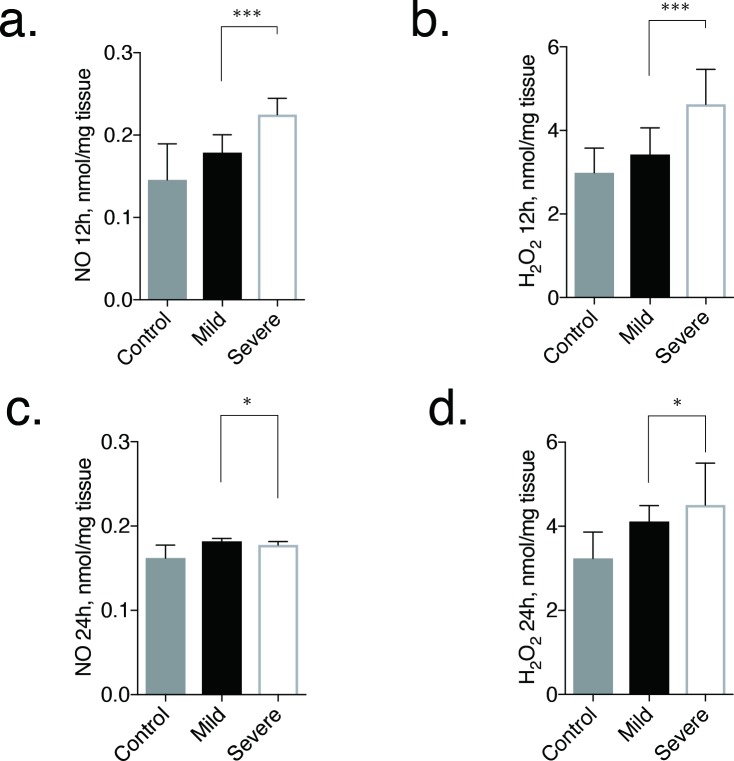
Fig 3. Evaluation of NO and H2O2 concentrations in kidneys at 12 and 24 h after ischemia-reperfusion injury.
The bar graphs show the grade of renal tubule injury and fibrosis at day 28, determined from pathological tissue specimens. Error bars represent the range of the median. There is a statistical difference in NO and H2O2 concentrations in the kidney at 12 h (P < 0.001) and 24 h (P < 0.050) between the mild and severe AKI groups. *p < 0.050, ***p < 0.001.

