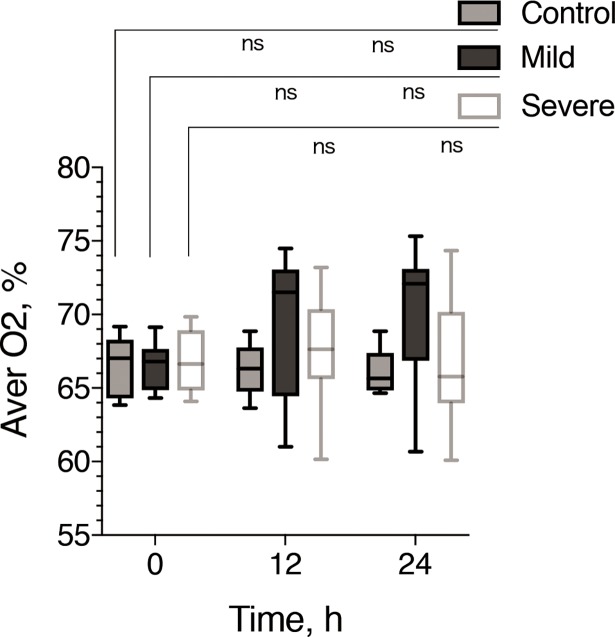
Fig 4. Longitudinal time course of oxygen saturation after renal ischemia-reperfusion in the mild and severe ischemia groups with L-NAME administration.
Box and whisker plots of the time course of renal oxygen saturation for the mild (black) and severe (white) ischemia-reperfusion groups. The box indicates the 25th and 75th quartiles, with the line inside each box indicating the median, and the whiskers indicate the maximum and minimum renal oxygen saturations. The oxygen saturation before injury and at the different time points of measurement after injury (12 and 24 h) were also evaluated using Dunn’s multiple comparisons. ns, not significant.

