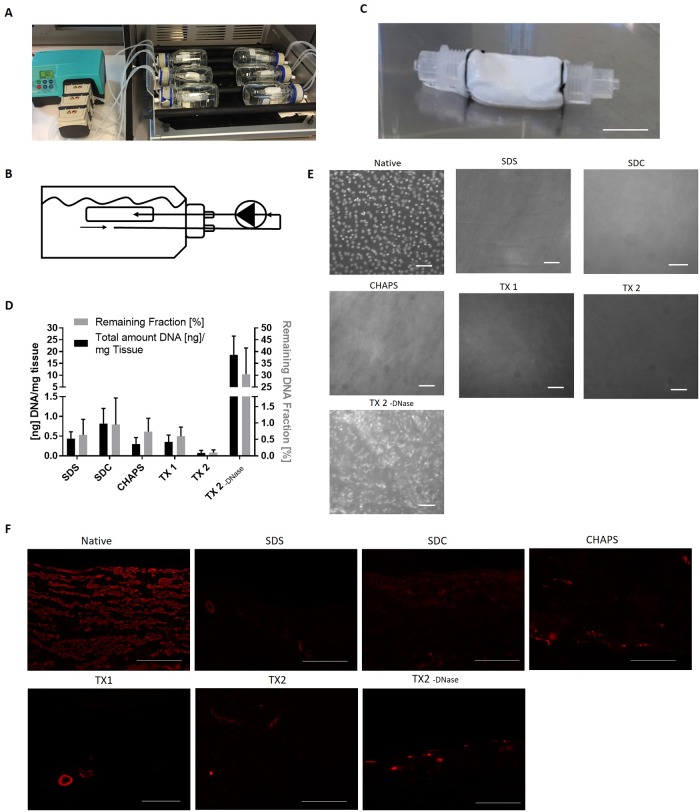
Fig 2. Decellularization efficacy.
Porcine vena cava were decellularized according to the respective protocols and DNA content was measured. (A) Setup of the bioreactor, with vena cava inside 250mL flasks connected with tubing system to peristaltic pumps. (B) Schematic overview of perfusion through vena cava, allowing circulating liquid flow. (C) Illustrative picture of a decellularized vein connected to luers. Scale bar represents 2.5 cm. (D) DNA in the ECM was quantified and the result shown as ng DNA/mg tissue (left y-axis) and as % of remaining DNA compared to the DNA content of the same native blood vessel prior to decellularization (right y-axis) (100%, n = 4). Both Y-axes were divided into 2 sections to show small differences in the DC groups. (E) DAPI stained double-stranded DNA on the luminal side of ECM of the native blood vessel and the DC groups. Scale bar represents 50 μm. (F) Staining of paraffin-embedded sections with anti-alpha smooth muscle actin. Scale bar represents 100 μm.

