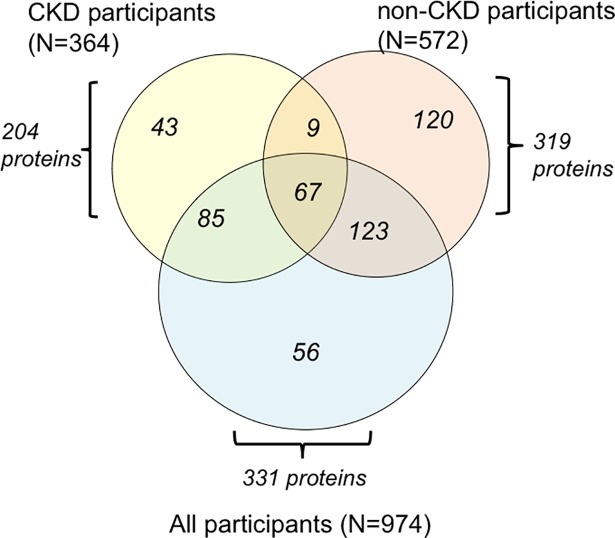
Fig 2. Results of random forest regression performed on full sample and sub-groups stratified by chronic kidney disease (See Attached File).
Random survival forest regression was applied first to the full sample (N = 974 participants), then to the sub-groups with baseline CKD (N = 364 participants) and without baseline CKD (N = 572 participants). Forest regression of the full sample of participants yielded 331 proteins associated with HF outcomes (blue circle). Analysis of the sub-group with CKD resulted in 204 proteins (yellow circle), and analysis of the sub-group without CKD yielded 319 proteins (orange circle).

