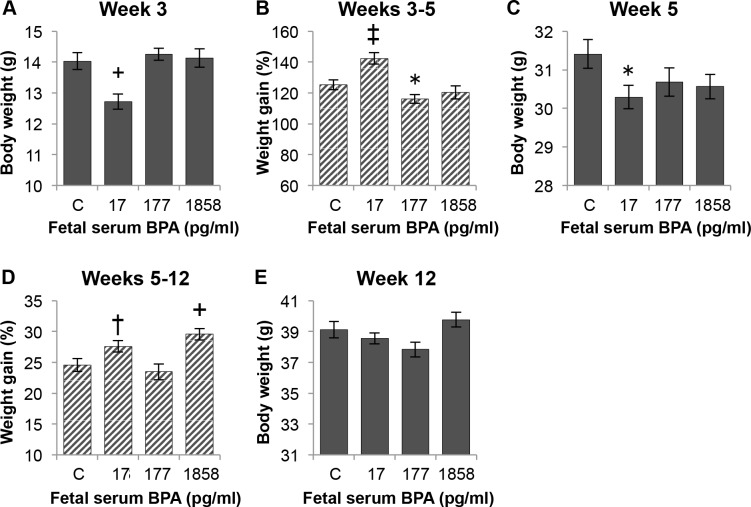
Fig 2. Effect of perinatal serum BPA concentration on weaning weight and post-weaning weight gain.
Animals from the three different growth tertiles are combined in each treatment group in this figure. Panel A) body weight of males in each treatment group at weaning on week 3. Panel B) weight gain between weeks 3–5. Panel C) body weight at week 5. Panel D) weight gain between weeks 5–12. Panel E) body weight at week 12 (the BPA-1858 males were significantly heavier than the BPA-17 or BPA-177 males; P < 0.05). Data are mean±SEM. Comparisons of BPA exposure group vs. control group: †P = 0.06, *P<0.05, +P<0.01, ‡P<0.001. See also S2 Fig in Supporting Information.

