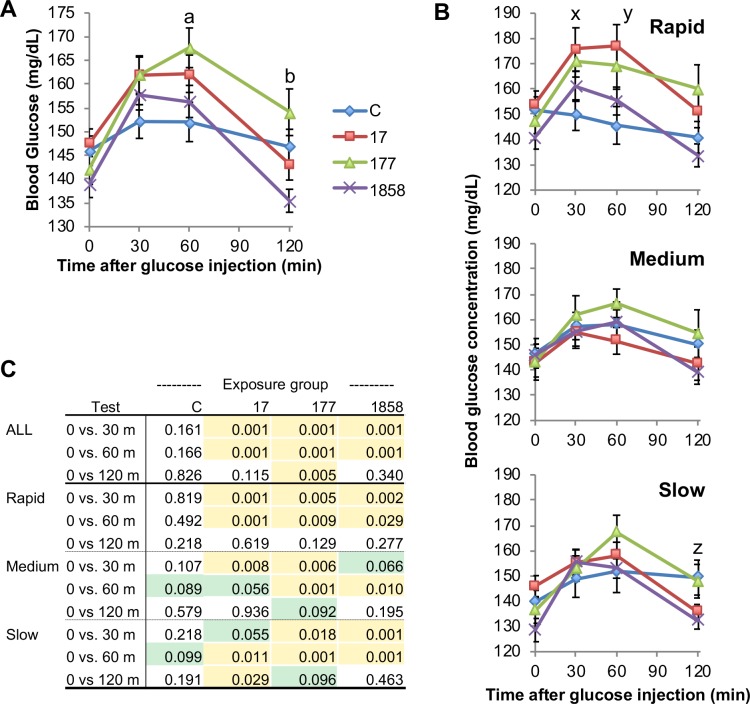
Fig 4. Effect of BPA and post-weaning growth rate on a low-dose glucose tolerance test (GTT).
Panel A) Effect of BPA exposure vs. controls (C) without regard to post-weaning growth tertile. Panel B) Effect of BPA exposure within each growth tertile group (rapid, medium, slow). Letters in Panels A and B indicate statistically significant differences between BPA dosed males in comparison to controls at each specific time point. Panel C) The blood glucose response to the glucose injection for males in each separate treatment group at time 30, 60 and 120 min was compared to their time 0 value. P values shaded in yellow for these comparisons are statistically significant relative to time 0 (P < 0.05), while values shaded in green showed a tendency to be different from time 0. Values are mean±SEM. a: Controls vs. BPA-177, P < 0.05; b: Controls vs. BPA-1858, P < 0.05. x: controls vs. BPA 17, P < 0.05. y: controls vs. BPA 17, P < 0.01. z: controls vs BPA-1858, P < 0.05.

