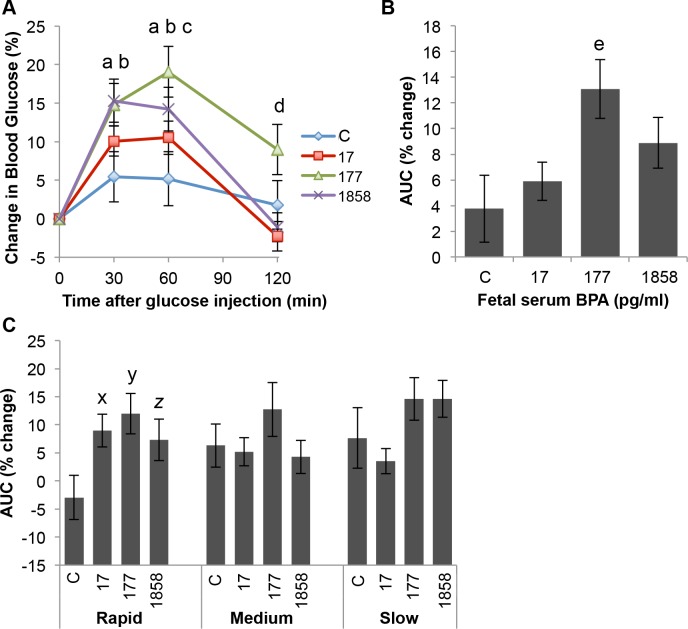
Fig 7. Percent change relative to baseline in blood glucose levels in response to a low-dose glucose tolerance test.
Panel A) Effect of fetal serum BPA concentration alone, ignoring post-weaning growth tertile, on blood glucose levels at each timepoint after glucose injection. Panel B) Effect of fetal serum BPA concentration (ignoring growth tertile) on the area under the concentration time curve (AUC) for percent change in blood glucose levels relative to baseline in response to glucose challenge. Panel C) Effect of BPA exposure within each growth tertile group on the AUC for percent change in blood glucose relative to baseline. Values are mean±SEM. a: control vs. BPA-177 P<0.01; b: control vs. BPA-1858 P<0.05; c: control vs. BPA-17 P<0.05; d: control vs. BPA-177 P<0.05; x: rapid controls vs rapid BPA-17 P < 0.05; y: rapid controls vs. BPA-177 P < 0.05; z, rapid controls vs. rapid BPA-1858 P = 0.059.

