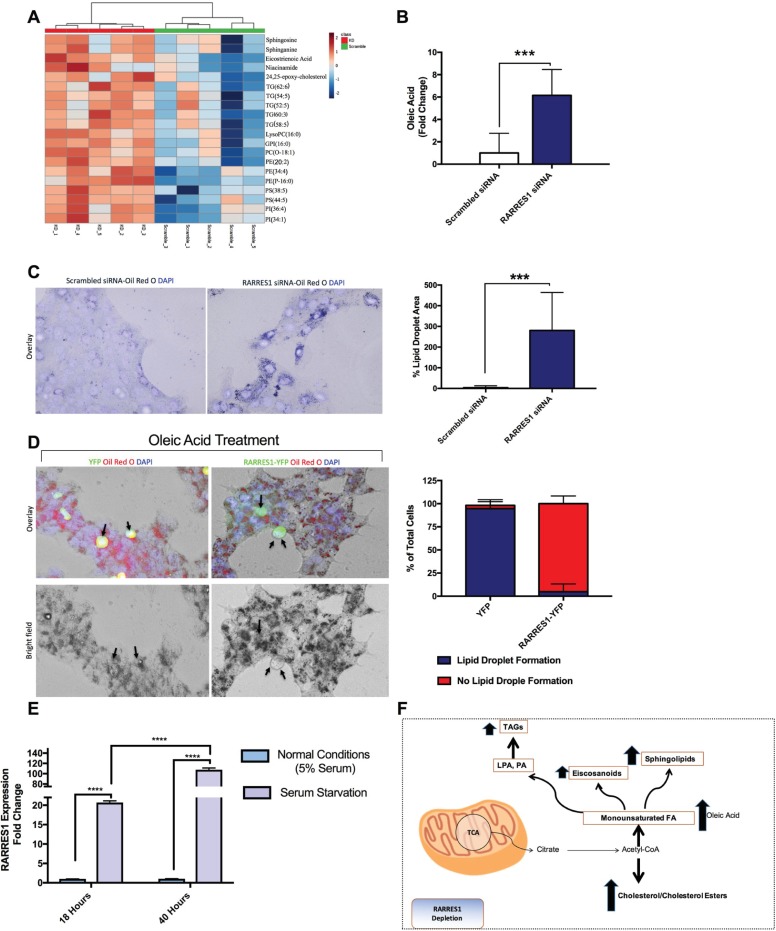
Fig 1. RARRES1 regulates lipid accumulation.
(A) Classes of metabolites measured by non-targeted LC-MS analysis of transient RARRES1 knockdown MCF 10A cells and scrambled control cells. (B) GC-MS was run in transient RARRES1 knockdown MCF 10A cells and monounsaturated fatty acids were analyzed. Oleic acid is represented in the bar graph. (C) RARRES1 was transiently knocked down in MCF10A cells and Oil Red O staining was used to stain for lipid accumulation. The bar graph represents the intensity of lipid droplet staining. Three biological replicates are represented in the bar graph. (D) RARRES1-YFP was exogenously expressed and the transfected cells were treated with oleic acid and stained with Oil Red O to localize lipid droplets. The numbers of cells with YFP or RARRES1-YFP transfection displaying lipid droplets or no lipid droplets were counted in both HEK 293T cells and MCF 10A cells. The y-axis represents the % total of cells with lipid droplet formation (blue) and % cells with no lipid droplet formation (red). (E) MCF10A cells were serum starved for 18 hours or 40 hours. qPCR analysis was subsequently done. 18S was used as the endogenous control. (F) A schematic representation of metabolites that were upregulated in RARRES1-depleted cells.

