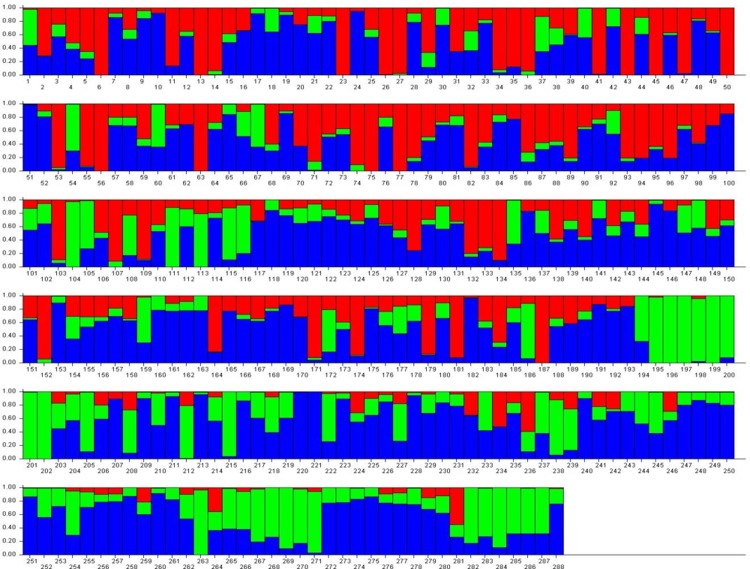
Fig 3. Bar graphs for three subpopulations (estimated following the approach of Evanno, 2005) are indicated by different colors.
The vertical coordinates of each subpopulation indicates the membership coefficient for each individual. The horizontal axis shows genotypes under study. In each sub population, each vertical bar represents one genotype.

