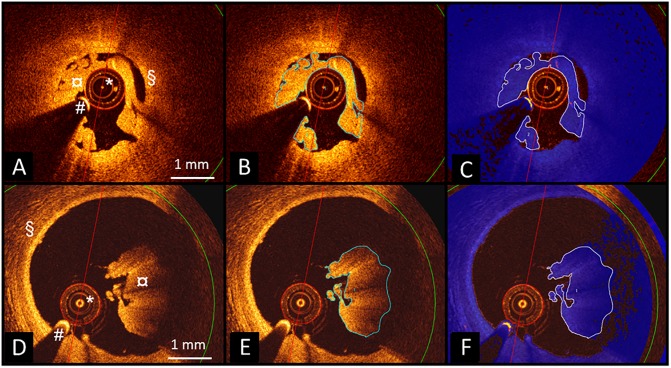
Fig 1. Examples of thrombus assessment by the QCU-CMS image analysis software in OCT image frames of two patients with white (A) and red thrombus (D).
After manual tracing of the thrombi (B,E), attenuation analysis was performed including regions with attenuation values above the designated threshold value (displayed in blue) (C,F). Accurate segmentation of the luminal border of the thrombus and the contrast-filled flow area of the vessel can be seen in C and F. *) OCT catheter, #) guidewire artefact, ¤) thrombus, §) vessel wall. OCT, optical coherence tomography.

