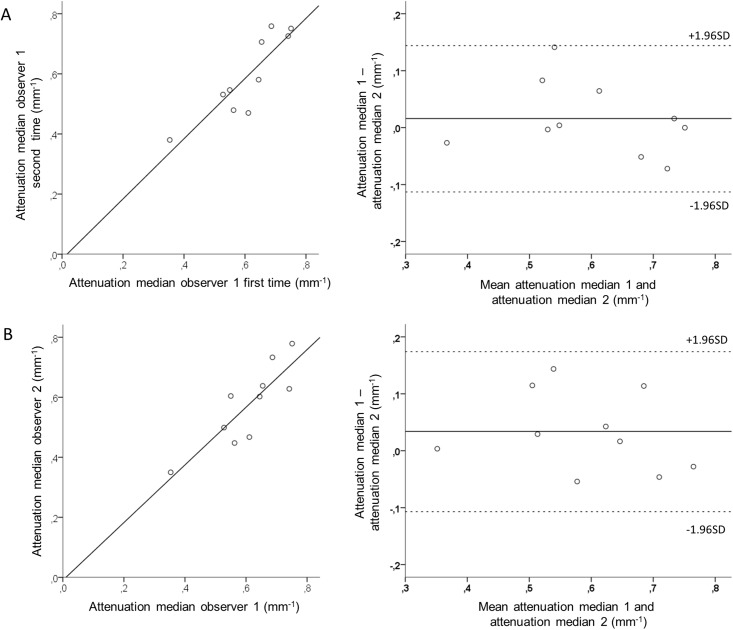
Fig 2. Intra- and interobserver variability of measurement of thrombus attenuation in OCT images using image analysis software.
Scatterplot (left) and Bland-Altman plot (right) of intraobserver (A) and interobserver (B) comparison for median attenuation. OCT, optical coherence tomography; SD, standard deviation.

