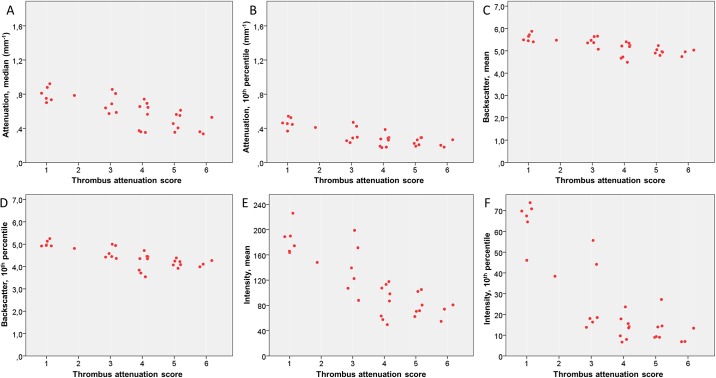
Fig 3. Relationship of thrombus attenuation score and parameters measured by image analysis software in thrombus areas in OCT images.
Scatterplots for median attenuation (A), 10th percentile of attenuation (B), mean backscatter (C), 10th percentile of backscatter (D), mean grayscale intensity (E) and 10th percentile of grayscale intensity (F). OCT, optical coherence tomography.

