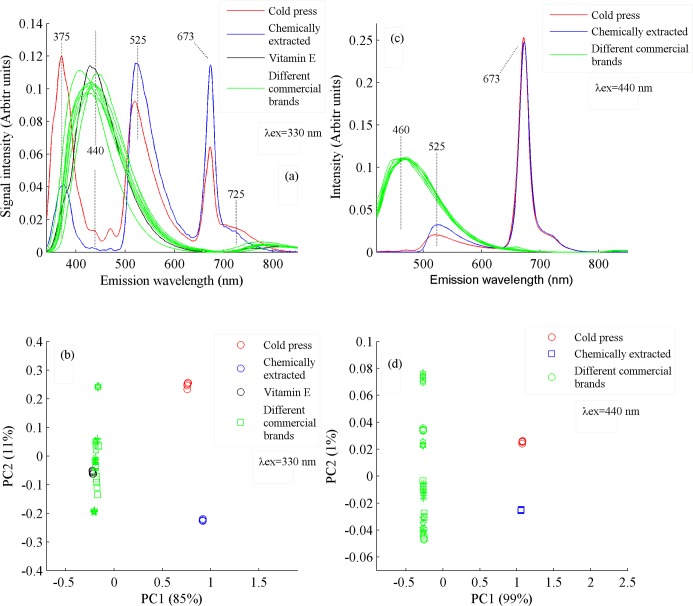
Fig 6.
(a) Fluorescence spectra of vitamin E, canola oil samples extracted by cold press, chemical method and eight commercial brands when excited at 330 nm. (b) PCA scatter plot between PC1 & PC2 shows the classification among vitamin E, cold press, chemically extracted and eight commercial brands of canola oil, whom spectra are shown in Fig 6A. (c) Fluorescence spectra of cold pressed, chemically extracted and eight commercial brands of canola oil when excited at 410 nm. (d) PCA scatter plot between PC1 & PC2 shows the classification among cold pressed, chemically extracted and eight commercial brands of canola oil, whom spectra are shown in Fig 6C.

