Fig 8.
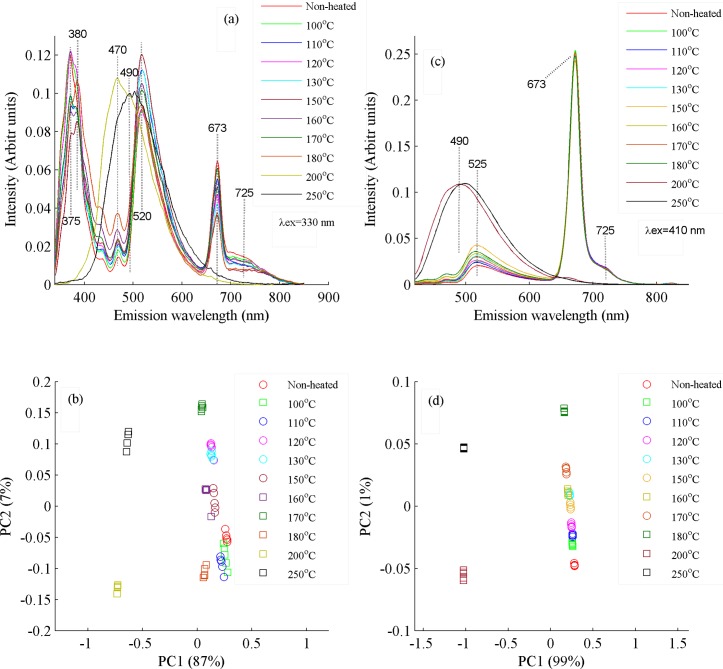
(a) Fluorescence spectra of non-heated and heated cold pressed canola oil samples at 100, 110, 120, 130, 140, 150, 160, 170, 180, 200 and 250°C when excited at wavelength of 330 nm. (b) PCA scatter plot between PC1 and PC2 which shows classification between non-heated and heated cold pressed canola oil samples, whom spectra are shown in Fig 8A. PC1 explains 87% and PC2 7% variances in the data. (c) Emission spectra of non-heated and heated cold press oil samples at 100, 110, 120, 130, 140, 150, 160, 170, 180, 200 and 250°C when excited at wavelength of 410 nm. (d) PCA scatter plot between PC1 and PC2 which shows classification among non-heated and heated cold pressed canola oil samples, whom spectra are shown in Fig 8C. PC1 explains 99% and PC2 1% variances in the data.

