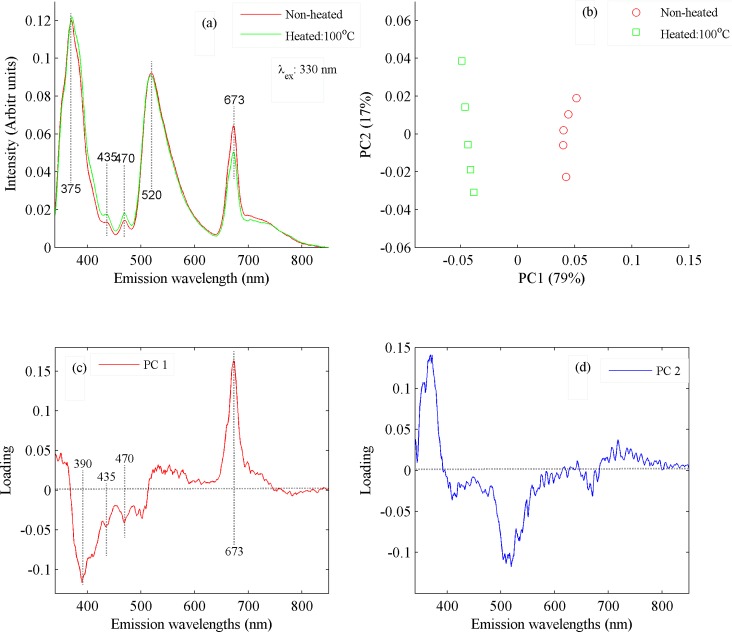
Fig 9.
(a) Fluorescence spectra of non-heated and heated cold pressed oil samples at 100°C when excited at 330 nm. (b) The PCA scatter plot between PC1 & PC2 which shows classification between the non-heated and heated cold pressed oil sample at 100 oC, whom spectra are shown in Fig 9A. (c) Loading vector of PC1, which are produced from florescence spectra shown in Fig 9A. (d) Loading vector of PC2, which are produced from florescence spectra shown in Fig 9A.

