
Fig. 2.
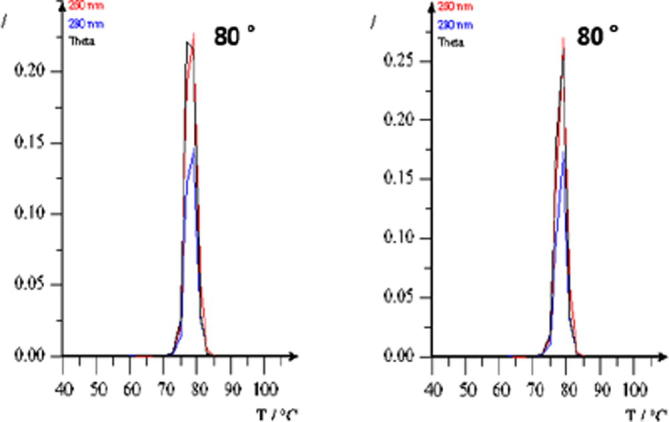
Melt curve analysis of the PIK3CA E545A (left) and PIK3CA pseudogene (right) in the same DNA fragment area.
Official websites use .gov
A
.gov website belongs to an official
government organization in the United States.
Secure .gov websites use HTTPS
A lock (
) or https:// means you've safely
connected to the .gov website. Share sensitive
information only on official, secure websites.
Melt curve analysis of the PIK3CA E545A (left) and PIK3CA pseudogene (right) in the same DNA fragment area.