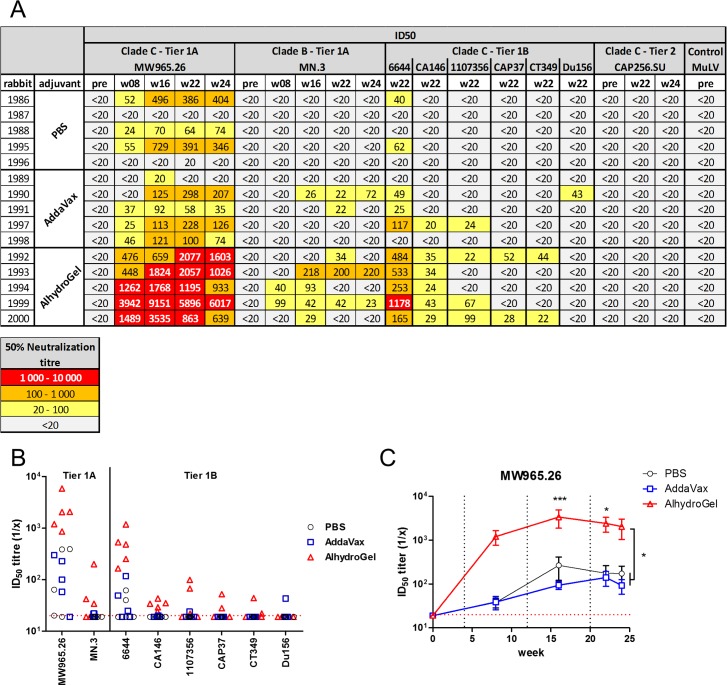
Fig 4. Serum neutralisation measured by the TZM-bl assay.
A) The 50% neutralisation titres are color-coded to reflect their potency range as indicated. Titres below 20 are considered negative and not color-coded. B) ID50 titres at week 22 reflecting enhanced neutralisation in the Alhydrogel group. C) Time course of ID50 titres for MW965.26 are significantly higher in the Alhydrogel group. Dotted red line represent assay detection limit (1/20 dilution), all data points below detection limit are plotted as 19. Dotted black lines represent time points of protein boosts.

