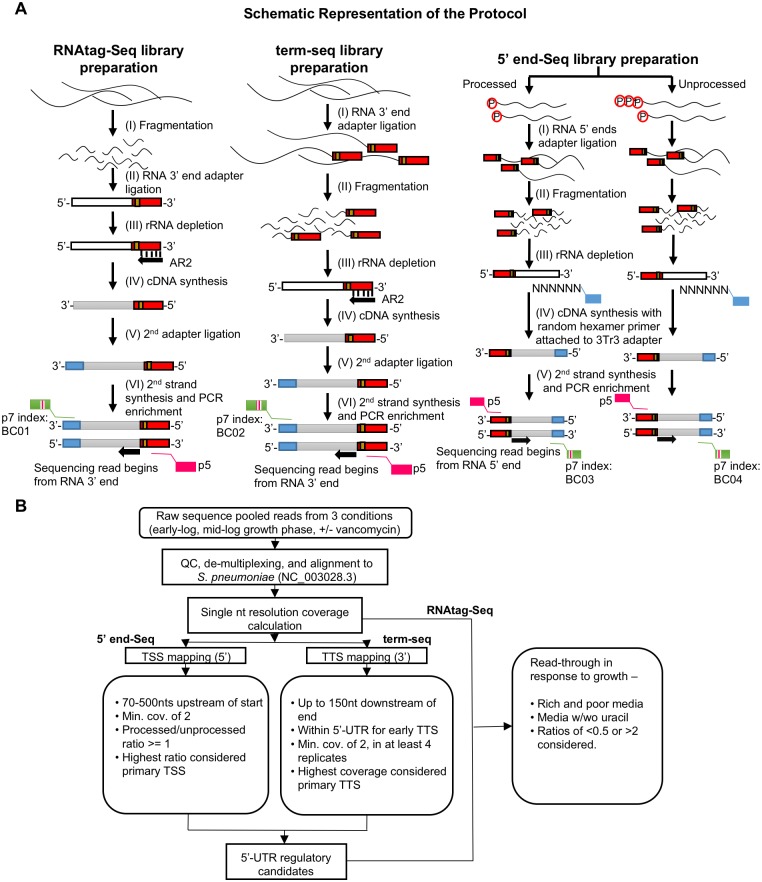
Fig 1. Schematic representation of the sequencing and data analysis methodology.
(A) A description of the experimental pipeline. RNA-Seq (left column) and term-seq (middle column) libraries were prepared according to protocols described in [34,35]. 5’ end-Seq libraries (right column) were generated by dividing the total RNA into 5’ polyphosphate treated (processed) and untreated (unprocessed) samples and subsequently processed according to protocols described in [22,64]. White and grey lines correspond to RNA and cDNA, respectively and colored blocks represent unique sequence barcodes. Illumina sequencing adaptors with index barcodes are also indicated. (B) A brief description of the analysis pipeline. Raw reads from all three sequencing methodologies obtained from three environmental conditions (early-log and mid-log growth phase in the presence and absence of vancomycin) were de-multiplexed and aligned to T4 (NC_003028.3). Based on the reads mapped, single nucleotide coverage was calculated. Coverage of the 5’ end of the reads calculated for the 5’ end-Seq was used to determine the transcription start sites. Coverage of the 5’ end of the reads from term-seq was used to determine the transcription termination sites. RNA-Seq coverage was used to calculate the read-through across candidate 5’ untranslated regions with early transcription terminators. Read-through responses of the candidates in different media conditions (rich and poor media, media with and without uracil) were analyzed to identify environment-responsive RNA regulators.

