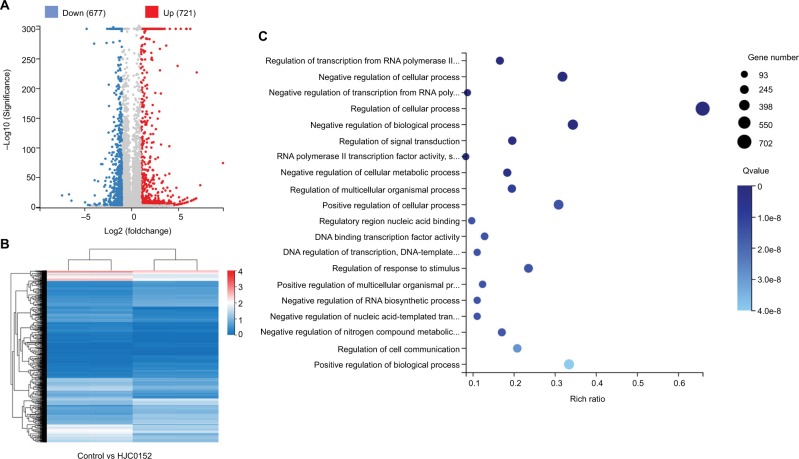
Figure 6.
DEGs affected by HJC0152 treatment.
Note: (A) Scatter plot of DEGs. Red and blue dots represent the down- and up-regulated genes, respectively. (B) Hierarchical clustering of global gene expression pattern of the HJC0152-treatment and control cells. Gradient color barcode at top right indicates fold change of expression (log2). (C) The 20 most enriched pathways (with lowest Q value) based on GO analysis. Rich factor is the ratio of DEGs to all genes in this pathway.
Abbreviations: DEG, differentially expressed genes; GO, Gene Ontology.

