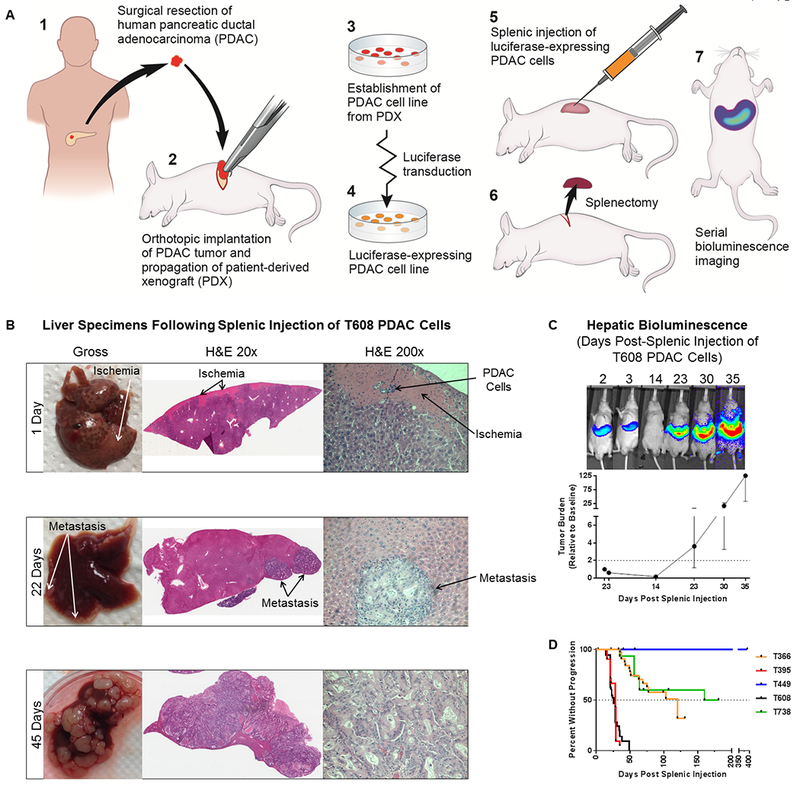
Fig 1. In vivo model of hepatic micrometastatic pancreatic ductal adenocarcinoma (PDAC).

A) Schematic of PDAC cell line establishment and the in vivo model. B) Gross necropsy specimens and H&E staining of livers harvested from mice at 1 day, 22 days, and 45 days after splenic injection of patient-derived PDAC (T608) cells. C) Hepatic tumor burden is tracked with serial in vivo bioluminescence imagining. A representative mouse at different time points following splenic injection of PDAC (T608) cells (top) and a growth curve of hepatic tumor burden relative to 48 hours post-splenic injection (n = 11). Data are expressed as median ± interquartile range. The dotted line represents a relative hepatic tumor burden of 2.0, defined as disease progression. D) Kaplan-Meier curves of time-to-progression for five patient-derived PDAC cell lines (T366: n = 38, T395: n = 21, T449: n = 14, T608: n = 101, T738: n = 15).
