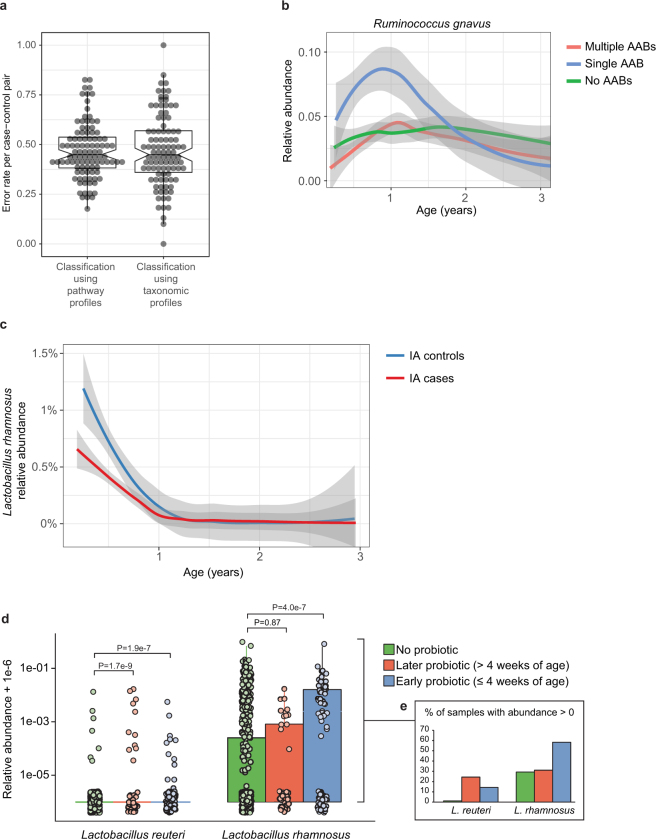
Extended Data Fig. 6. Differences between cases and controls.
a, The gut microbiome functional (left) and taxonomic (right) profiles were classified between cases and controls using leave-one-out cross-validation (n = 3,366 samples), in which one case–control pair was held-out in turn. Data show error rates for classifying these held-out samples per fold (a data point per fold, n = 100 folds). This suggests weak but better-than-random classification between cases and controls. Notched box plots are as in Extended Data Fig. 4. b, Average longitudinal abundance of Ruminococcus gnavus in Finland (n = 2,630 samples) stratified by the number of observed persistent autoantibodies (AABs); no autoantibodies (that is, healthy control), a single autoantibody, or multiple (two or more) autoantibodies. c, Average longitudinal abundance of Lactobacillus rhamnosus in IA cases and controls (n = 7,017 samples). L. rhamnosus is more abundant in controls (q = 0.055). The curves in b and c show LOESS fit per group, and shaded areas show 95% confidence interval for each fit, as implemented in geom_smooth function in ggplot2 R package. d, Abundance (left) and prevalence (right) of Lactobacillus reuteri and L. rhamnosus in the first stool sample of each individual (collected at approximately three months of age) in association with early probiotic supplementation. ‘No probiotic’ indicates no probiotics given before the first stool sample (n = 583); ‘later probiotic’ refers to probiotics given later than the first four weeks but before the first stool sample (n = 45); ‘early probiotic’ refers to probiotics given during the first four weeks of life (n = 84). Numbers (n) per clinical centre are given in Extended Data Table 2. L. reuteri and L. rhamnosus were more abundant and prevalent in groups with probiotics supplementation. Visual jitter was added to make data equal to zero distinguishable, and boxes denote the IQR, when applicable. The shown P values were obtained by applying Fisher’s exact test (two-sided) to presence or absence count data (counting samples in which the species were present).

