
Fig. 2. The early gut microbiome is characterized by early heterogeneity of Bifidobacterium species and individualized accrual of taxa over time.
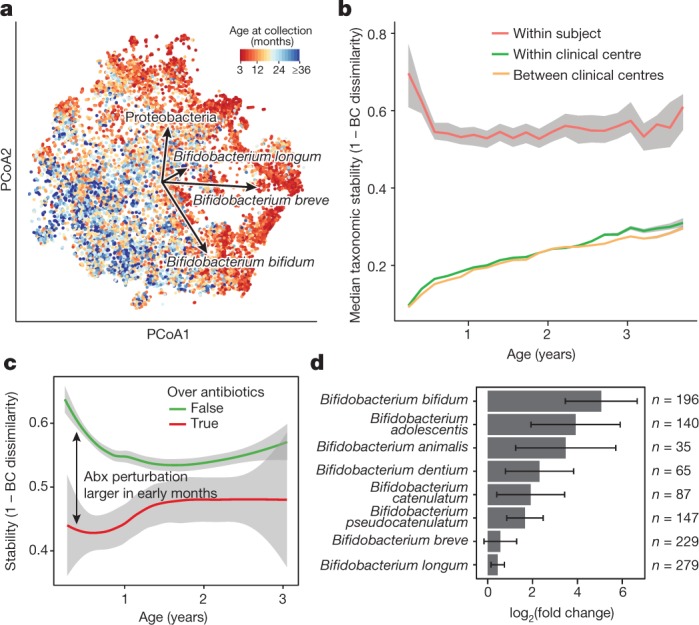
a, Principal coordinate analysis (PCoA) ordination of microbial beta diversities (n = 10,913 samples), measured by Bray–Curtis dissimilarity. Arrows show the weighted averages of key taxonomic groups. b, Microbiota stability, measured by Bray–Curtis (BC) dissimilarity (n = 10,750 samples) in three-month time windows, over two-month increments, stratified into three groups: within subject, within clinical centre, and between clinical centres. Lines show median values per time window. Shaded area denotes the estimated 99% confidence interval. Gut microbial communities were highly individual. c, Influence of antibiotic (Abx) courses on microbial stability, measured by Bray–Curtis dissimilarity over consecutive stool samples (<50 days apart) from the same individual during the first three years of life, and stratified by whether antibiotics were given between the two samples (n = 654 observations with antibiotics, n = 6,734 observations without antibiotics). Curves show locally weighted scatterplot smoothing (LOESS) for the data per category. Shaded areas show permutation-based 95% confidence intervals for the fit. d, Decreases in the most common Bifidobacterium species in connection to oral antibiotic treatments. Fold change was measured between consecutive samples with an antibiotic course between them, given that the species in question was present in the first of the two samples. Sample size per species (n) indicates the number of sample pairs in which the species in question was present in the sample before the antibiotic treatment. Bars show bootstrapped mean log2(fold change) (that is, decrease), and error bars denote s.d. (n = 1,000 bootstrap samples).