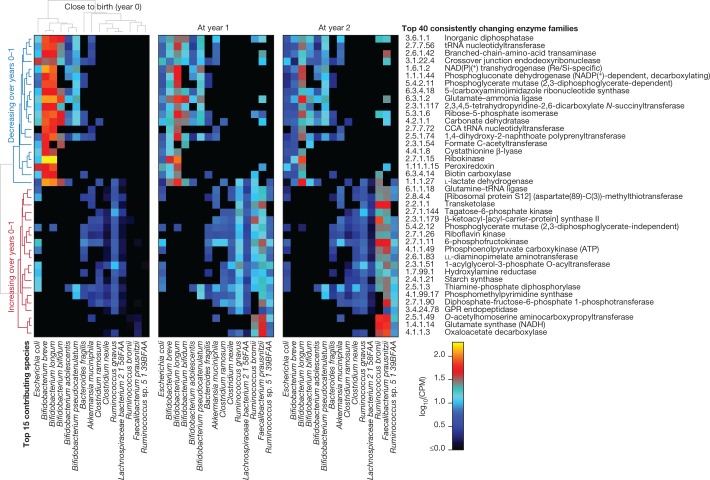
Fig. 3. Consistent changes in enzymatic content of the gut microbiome in early life.
We identified enzyme families (level-4 Enzyme Commission (EC) categories) that exhibited the most consistent within-subject changes in total community abundance between the ages of 3 months and 1 year. The top 20 most consistent increases or decreases are presented and stratified according to their top 15 contributing species. Heat map values reflect the mean contribution of each species to each enzyme over samples (n = 733 at 3 months; 675 at 1 year; and 382 at 2 years). Values reflect units of copies per million (CPM) normalized to total read depth (including unmapped reads and reads mapped to gene families lacking EC annotation). Rows (enzymes) and columns (species) are clustered according to Spearman correlation at 3 months; subsequent years are ordered according to clustering at 3 months.

