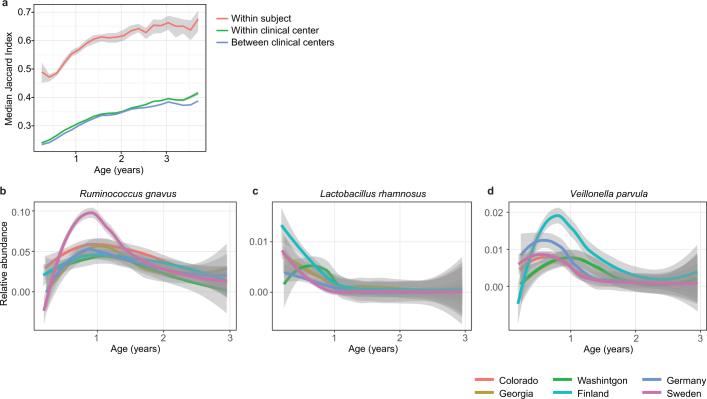
Extended Data Fig. 2. Stability and regional differences of taxonomic profiles.
a, Stability of the microbiota, measured by the Jaccard index (n = 10,750 samples) in three-month time windows, over two-month increments, stratified into three groups: within subject, within clinical centre, and across clinical centres. Lines show the median per time window. Shaded areas show the 99% confidence interval estimated using binomial distribution. Compare to Fig. 2b, which shows the same analysis measured by Bray–Curtis dissimilarity. b–d, Average longitudinal abundance of Ruminococcus gnavus (b), Lactobacillus rhamnosus (c) and Veillonella parvula (d) per clinical centre (n = 10,194 samples). The curves show LOESS fit for the relative abundances, as above.

